About:Math, science and economics video animations. Former teacher, programmer, engineer, scuba ...
Math, science and economics video animations. Former teacher, programmer, engineer, scuba ...View More
Description: How is wealth distributed in the USA?
In all of our outreach we might want to think about the plight of the 50% who have few resources. The rich half of America is about 100 times richer than the poor half. That does not seem fair to me.
Reference: Federal Reserve Bulletin, September 2017, Changes in U.S. Family Finances from 2013 to 2016: Evidence from the Survey of Consumer Finances.
Page 13, Table: Changes in U.S. Family Finances from 2013 to 2016. Table 2. Family median and mean net worth,
Description: Carbon Dioxide forecast. 170321
Vimeo: https://vimeo.com/stevenlevymath
Teachertube: stevenlevymath.com
Facebook: https://www.facebook.com/stevenlevymath
Reference: Data from Earth Systems Research Laboratory
https://www.esrl.noaa.gov/gmd/ccgg/trends/data.html
ftp://aftp.cmdl.noaa.gov/products/trends/co2/co2_annmean_mlo.txt
See www.esrl.noaa.gov/gmd/ccgg/trends/ for additional details.
#
# Data from March 1958 through April 1974 have been obtained by C. David Keeling
# of the Scripps Institution of Oceanography (SIO) and were obtained from the
# Scripps website (scrippsco2.ucsd.edu).
#
# The estimated uncertainty in the annual mean is the standard deviation
# of the differences of annual mean values determined independently by
# NOAA/ESRL and the Scripps Institution of Oceanography.
#
# NOTE: In general, the data presented for the last year are subject to change,
# depending on recalibration of the reference gas mixtures used, and other quality
# control procedures. Occasionally, earlier years may also be changed for the same
# reasons. Usually these changes are minor.
#
# CO2 expressed as a mole fraction in dry air, micromol/mol, abbreviated as ppm
#
# year mean unc
1959 315.97 0.12
1960 316.91 0.12
1961 317.64 0.12
1962 318.45 0.12
1963 318.99 0.12
1964 319.62 0.12
1965 320.04 0.12
1966 321.38 0.12
1967 322.16 0.12
1968 323.04 0.12
1969 324.62 0.12
1970 325.68 0.12
1971 326.32 0.12
1972 327.45 0.12
1973 329.68 0.12
1974 330.18 0.12
1975 331.11 0.12
1976 332.04 0.12
1977 333.83 0.12
1978 335.40 0.12
1979 336.84 0.12
1980 338.75 0.12
1981 340.11 0.12
1982 341.45 0.12
1983 343.05 0.12
1984 344.65 0.12
1985 346.12 0.12
1986 347.42 0.12
1987 349.19 0.12
1988 351.57 0.12
1989 353.12 0.12
1990 354.39 0.12
1991 355.61 0.12
1992 356.45 0.12
1993 357.10 0.12
1994 358.83 0.12
1995 360.82 0.12
1996 362.61 0.12
1997 363.73 0.12
1998 366.70 0.12
1999 368.38 0.12
2000 369.55 0.12
2001 371.14 0.12
2002 373.28 0.12
2003 375.80 0.12
2004 377.52 0.12
2005 379.80 0.12
2006 381.90 0.12
2007 383.79 0.12
2008 385.60 0.12
2009 387.43 0.12
2010 389.90 0.12
2011 391.65 0.12
2012 393.85 0.12
2013 396.52 0.12
2014 398.65 0.12
2015 400.83 0.12
2016 404.21 0.12
Description: Warming waters a major factor in Gulf of Maine cod collapse
NOAA Research
http://research.noaa.gov/News/NewsArchive/LatestNews/TabId/684/ArtMID/1768/ArticleID/11410/Warming-waters-a-major-factor-in-Gulf-of-Maine-cod-collapse.aspx
Description: Reference Document: 
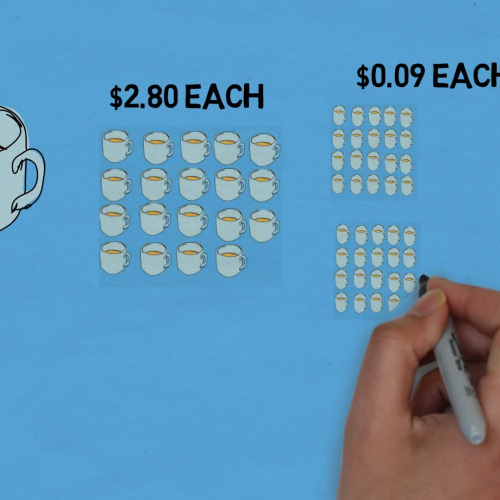
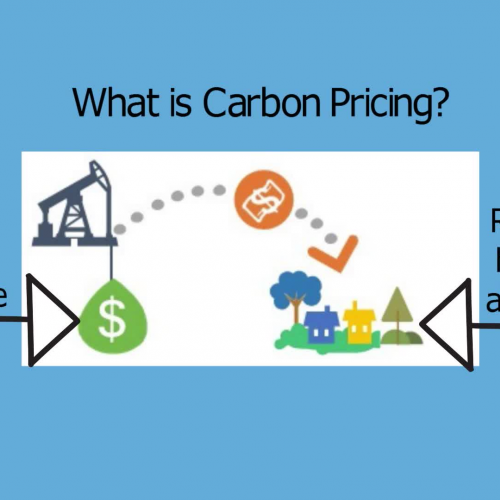
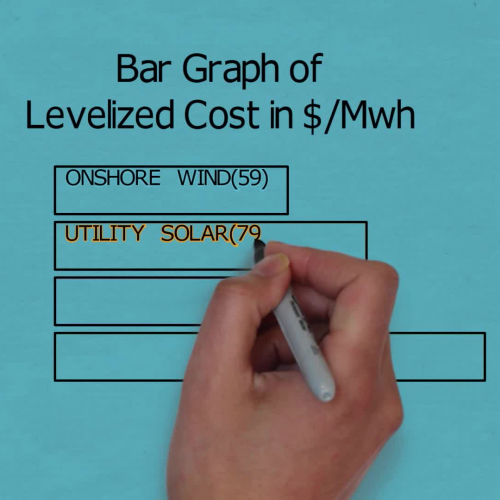
Comparing The Costs Of Renewable And Conventional Energy Sources, http://energyinnovation.org/2015/02/07/levelized-cost-of-energy/ , February 7, 2015
Author: Energy Innovation Policy and Technology LLC, http://energyinnovation.org/ Their mission is to accelerate progress in clean energy by supporting the policies that most effectively reduce greenhouse gas emissions.
Definition: Levelized Energy Cost (LEC), https://en.wikipedia.org/wiki/Cost_of_electricity_by_source
is the net present value of the cost of the electricity over the lifetime of a generating asset ($), divided by the total power produced (Mwh).
Notes! Costs are specific to each unique situation. You cannot easily compare costs from different studies. Calculating costs depends to some degree on assumptions. In this study the environmental cost of fossil fuels is not included. Solar and wind may require battery storage. Coal plants take longer to ramp up. Solar and wind have very little variable cost. If there is no demand then excess power goes nowhere. Siting and making use of existing structures may effect cost.
Coal_fired_power_plant_diagram.svg
This image is a work of a United States Tennessee Valley Authority employee, taken or made as part of that person's official duties. As a work of the U.S. federal government, the image is in the public domain in the United States.
Description: animation made with Videoscribe. This is the Massachusetts version. For details go here: https://malegislature.gov/Laws/SessionLaws/Acts/2008/Chapter298 .
Description: "Energy efficiency in Transportation", From Wikipedia, the free encyclopedia (Date: 2016/12/22), Sub Heading: "US Freight transportation"
Animation
Description: Reference: “Save the Plankton, Breathe Freely” by the National Geographic Society, http://nationalgeographic.org/activ.... Marine Plants 70%, Rain Forest 28%, Other 2%.
Reference: Ocean acidification, Wikipedia, Aug. 18, 2016, https://en.wikipedia.org/wiki/Ocean.... Average Surface Ocean pH: (year, pH, H+ Concentration; 1850, 8.18, 1.0; 2015, 8.07, 19%; 2050, 7.95, 70%)
Thanks for watching!
Facebook page: stevenlevymath.info
Teacher tube: stevenlevymath.info
Vimeo: vimeo.com/stevenlevymath
Please leave likes and comments.
This video was made with Videoscribe.