Graphing Quadratic Inequalities on Desmos
High School / Math
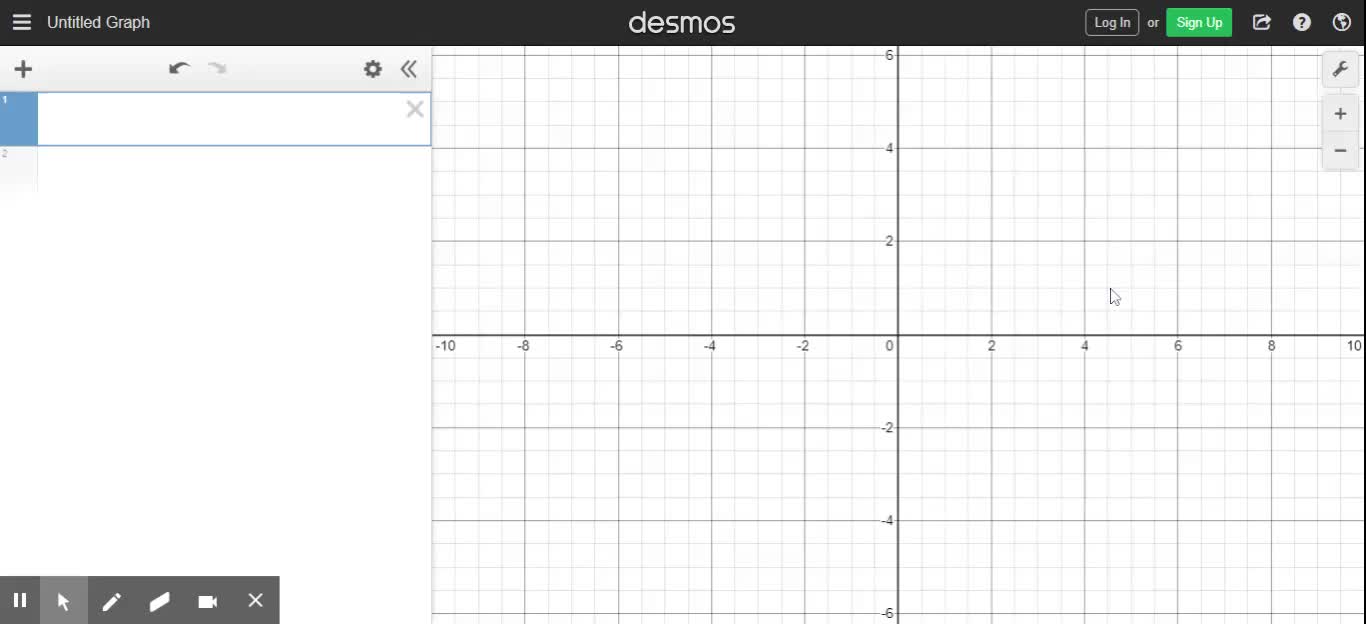
So one of the tools that you can use for graphing is does most dot com slash calculator. And this is a graphing calculator that you guys have access to. So when we look at these quadratics, that we're graphing the inequalities of. I can graph. Things similar to what we've been looking at. And so I just type in this function. And it shows me where the points are, the important points, and if I zoom in and move the graph around, I can see a vertex of negative one negative 5, a Y intercept of negative three, a corresponding point and negative two negative three. And then the shaded region is below the curve. But let's change this to greater than or equal to. You can just do that on your keyboard, hit the greater than symbol. And then the equals, and now it changes it to a solid parabola, and we shade a above the graph. So this is a good tool that you guys can use to check your graphs.


