Video4:Graph Lines y= -9/10x
High School / Math
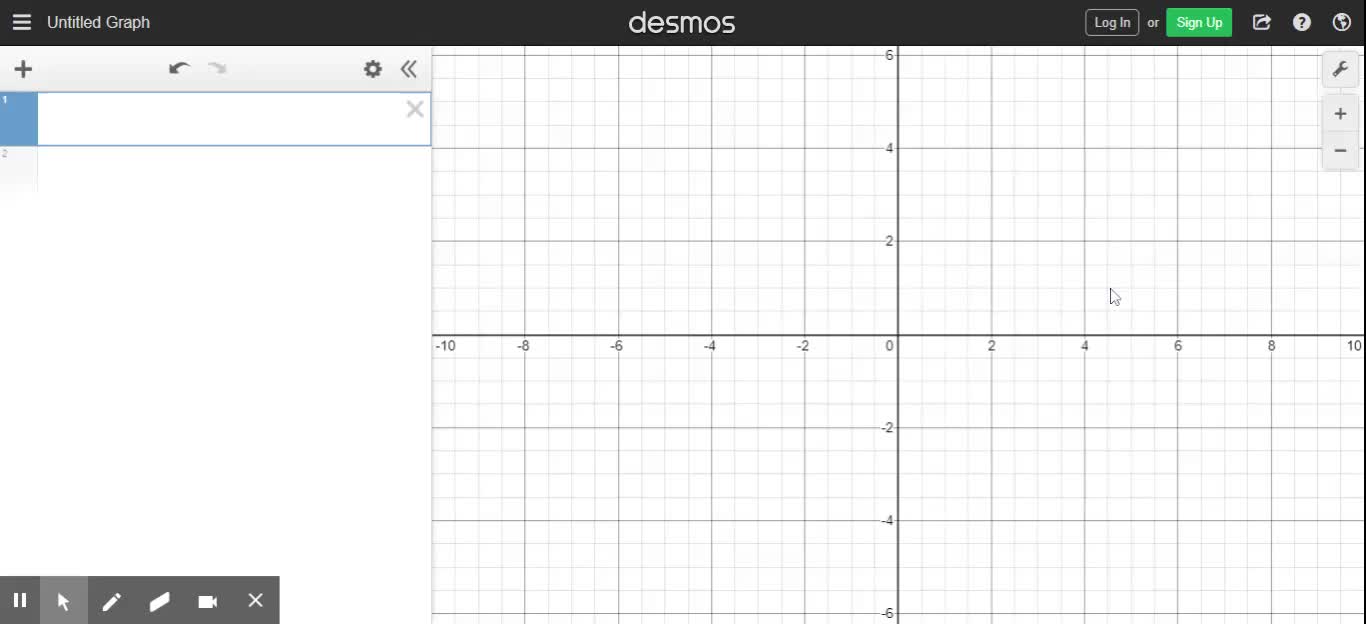
Here on this particular example, you see that you do have an X that's after this fraction. Which means that this number is a slope. If there were no X here, that means that this would be the number that you put a dot at on your Y axis. Because there's an X, that means that this number is your slope. The number behind it is your Y intercept. We don't see a number here. So it's a zero. There's an imaginary plus zero here. So we're going to put our dot on the positive zero. So I'm going to write this down. So if you see. Y equals, and you have a negative. You have a negative 9 over ten, and there's an X beside it. That means that this is your slope. Remember that the Y intercept is behind it. This is your Y intercept. So you're going to put a dot at zero. So let's go over here to the graph. And we're going to put our dot at the Y intercept, which is zero. So I'm going to put a dot right here. Sorry. Right here at zero. That is my Y intercept. And then I'm going to count the slope. Remember slope always tells me to go up 9 and to the left ten since it's negative. So let me count up 912-345-6789, and I need to go to the left ten. One, two, three, four, 5, 6, 7, 8, 9, ten. And we know that this is correct because a negative slope means that the graph is always pointing to the top left corner of the page. So now let's hit enter, so we just our line went through the origin. At Y equals zero. And that is correct.


